

Bitcoin can be rising on a daily chart while remaining below an important annual reference. A monthly candle can trade outside a band for weeks and finish back inside it. Two charts of the same move can therefore invite very different descriptions without either chart being wrong.
The useful starting point is price location: where the market sits relative to a defined pivot grid, which period supplied that grid and whether the latest observation is an unfinished move or a completed close. Those three details make a chart discussion more precise before any scenario is considered.
This guide develops the framework in How to Use Pivot Points in Trading: Bullish, Bearish or Neutral? It explains the neutral, bullish and bearish ranges, the role of the 0.382 references and the distinction between a temporary excursion and acceptance beyond a zone. The Bitcoin and S&P 500 examples are the recorded examples from the October 2026 walkthrough. They are discussed as historical observations, not live prices or verified probability estimates.
How to Use Pivot Points in Trading: Bullish, Bearish or Neutral?
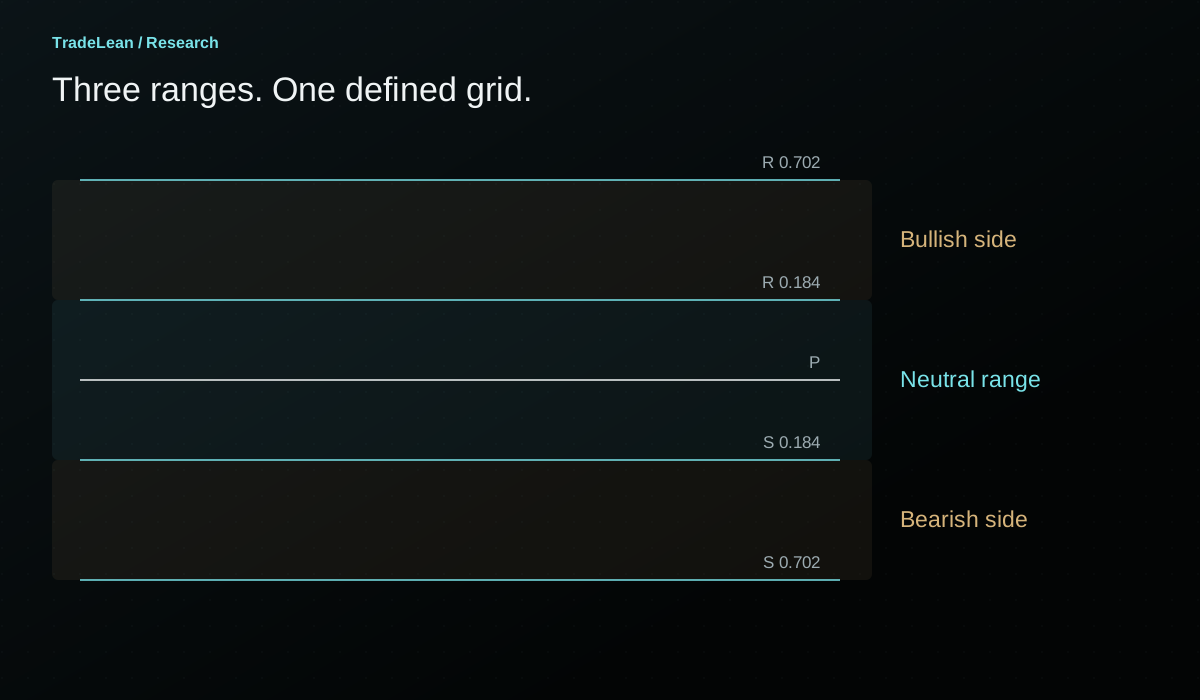
The three ranges on a pivot-point roadmap
A pivot grid gives the market a set of fixed reference prices for a defined period. The central pivot is P. References labelled R sit above it; references labelled S sit below it. In the TradeLean framework, the first areas of focus are the 0.184 zones around the centre and the more distant 0.702 zones.
The neutral range sits between S 0.184 and R 0.184. Bullish territory lies above the upper inner reference; bearish territory lies below the lower inner reference. These labels describe location relative to that particular grid. They do not classify an asset permanently, describe its fundamental value or identify a complete trading strategy.
The distinction matters when a headline says that Bitcoin is bullish or bearish without specifying a period. A move above a monthly R 0.184 can occur while price remains below the annual S 0.184. The monthly observation describes a recovery within a larger annual context. It does not automatically cancel that context.
For this article, begin with one grid. State its reference period explicitly and keep it unchanged during the review. A yearly grid calculated from the previous year's data is a convenient way to understand the examples, but the same arithmetic can be applied to other completed periods.
| Price location | Working description | What still needs to be observed |
|---|---|---|
| Between S 0.184 and R 0.184 | Neutral range | Whether price remains within the central area or establishes a close beyond a whole inner zone |
| Above R 0.184 | Bullish side of this grid | Behaviour around R 0.382 and the upper outer band |
| Below S 0.184 | Bearish side of this grid | Behaviour around S 0.382 and the lower outer band |
| Within a 0.184 band | At a transition area | The exact boundary, candle timeframe and eventual close |
| Within a 0.702 band | At an outer reference area | Rejection, continued consolidation or acceptance through the whole band |
Calculation reference: TradingView: Pivot Points Standard
What the neutral range actually describes
The neutral range is the central part of the map. Price may repeatedly move from one inner reference towards the pivot and then towards the other inner reference. A sequence of those moves can look active on a small chart while producing little progress through the larger grid.
In the walkthrough, I describe this as the area where neither side has established a decisive positional advantage. That is an interpretation of observed price behaviour. The formula itself does not measure the strength of buyers or sellers. It places a repeatable set of references around an average derived from a completed period.
This is why a large daily candle inside the annual neutral range should be described carefully. It may be an important move for someone studying the daily chart, but it may still leave price between the same annual landmarks. The size of the candle and the significance of its location are related questions, not identical ones.
There is also no fixed duration for a neutral phase. The grid does not contain a clock that forces consolidation to finish after a particular number of candles. A period can spend most of its life around the centre. Recording that outcome is as important as recording the more memorable move towards an outer band.
A useful neutral-range review asks whether closes are becoming concentrated on one side of P, whether attempts beyond an inner band are retained and whether the apparent progress survives the chosen candle close. It does not require inventing a directional call every time price crosses the central line.
Moving beyond the inner zone
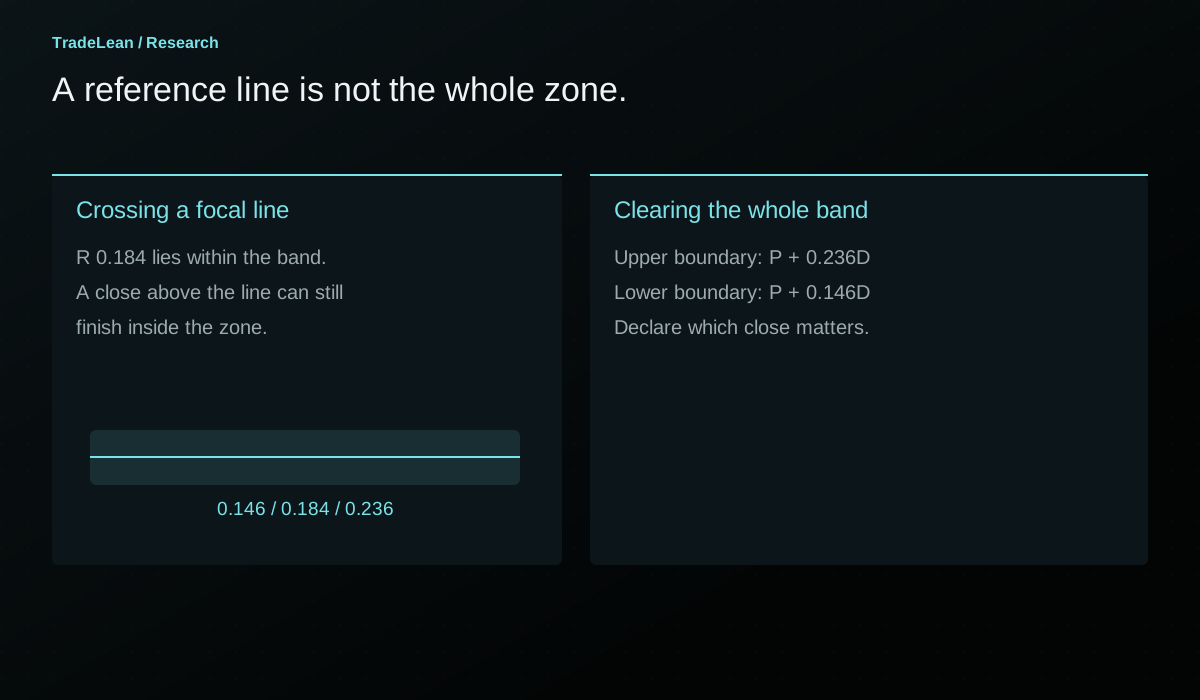
The 0.184 references mark the transition from the centre towards the directional parts of the roadmap. On the upper side, the relevant band runs from P + 0.146D to P + 0.236D, with R 0.184 inside it. On the lower side, the corresponding band runs from P - 0.236D to P - 0.146D, with S 0.184 inside it. Here D is the previous period's high-to-low range.
That definition immediately creates an important distinction. Crossing R 0.184 is not the same as clearing the entire upper inner band. A close above the focal line can still be inside the band. If the review rule requires a close beyond the whole zone, the higher boundary is the relevant upper threshold.
The same logic is mirrored below P. A move beneath S 0.184 can leave price within the lower inner band. A close below its lower boundary provides a different observation from a close below only the focal line. The labels should not be allowed to blur that difference.
I find it useful to write the interpretation in two stages. First record the location: above the line, inside the band or beyond the band. Then record the status of the candle: still forming or closed. This prevents an unfinished excursion from acquiring the language of a completed transition.
Why the 0.382 references remain on the chart
Between an inner reference and its outer 0.702 band lies the 0.382 level. In the video, I call R 0.382 or S 0.382 the opposing side's last line of defence. It is a memorable description of how I organise the map, rather than a claim that orders or intentions have been measured at that precise price.
The practical point is that leaving the central range does not guarantee a straight move to the outer band. Price can fail at an intermediate reference, return to the inner area and spend more time around the pivot. The 0.382 level provides a consistent place to distinguish those paths.
A review can therefore separate three events: the first crossing of the inner band, the encounter with 0.382 and the eventual arrival at an outer zone. Treating them as one inevitable event hides the time and adverse movement between them. It also makes a historical chart seem simpler than it felt while the period was developing.
The extended neutral range, between S 0.382 and R 0.382, is another way to describe that transition area. It does not replace the narrower neutral range. The narrower definition identifies the centre; the wider definition acknowledges that a move outside the centre can still fail before establishing progress towards an outer reference.
Both descriptions can be useful if they are named consistently. They become confusing when an article uses neutral to mean the inner range in one paragraph and the extended range in another without saying so.
Acceptance is a rule, not a feeling
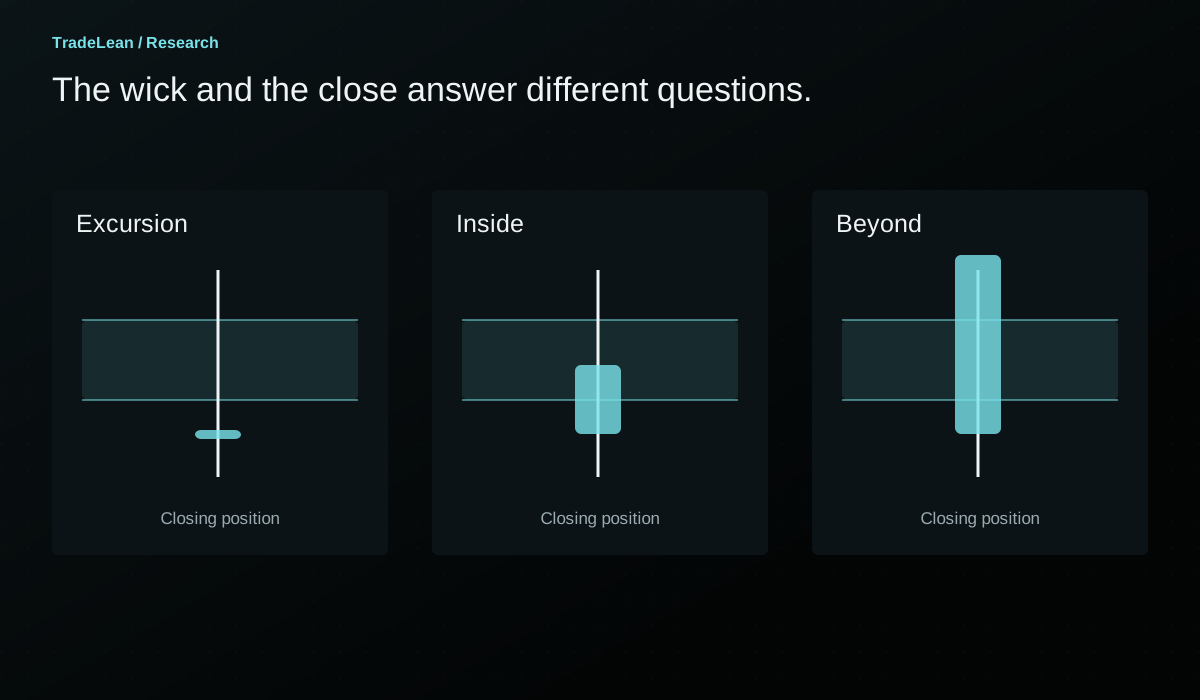
A chart can spend a substantial part of a month outside a reference area and then close back within it. During that month, the visible candle changes repeatedly. The final monthly close is one defined observation that can be recorded and compared with other months.
In the annual-grid examples, I use completed monthly candles to distinguish an excursion from a more durable close beyond a zone. This convention keeps the review reproducible. It does not prove that the next month must continue in the same direction or that the first close beyond a band is always the best execution point.
The word acceptance needs this explicit definition because it is otherwise easy to move the goalposts. One trader may mean a single hourly close; another may mean several daily closes; another may mean a monthly close followed by a successful retest. Those are different rules with different waiting times and different possible outcomes.
For a historical review, choose the rule before counting results. For example: a completed monthly close above the upper boundary of the annual inner band. Record the first date that satisfies the rule and do not replace it later with the candle that gives the most attractive outcome.
Waiting also has a cost. A monthly close can confirm location only after the month has ended. A large part of a move may already have occurred. A disciplined discussion should show that trade-off rather than suggesting that confirmation provides both certainty and the earliest possible price.
| Observation | What can be stated | What cannot yet be stated |
|---|---|---|
| Intramonth high above a band | Price traded above the boundary | The month accepted above it |
| Month closes inside the band | The excursion was not retained at that close | The band will hold indefinitely |
| Month closes beyond the full band | The defined closing condition occurred | The next candle must continue |
| Close is beyond the focal line but inside the band | Price finished on one side of the focal ratio | The whole zone was cleared |
| A later close returns through the band | The earlier interpretation needs review | Every earlier observation was meaningless |
Bitcoin's recorded January transition
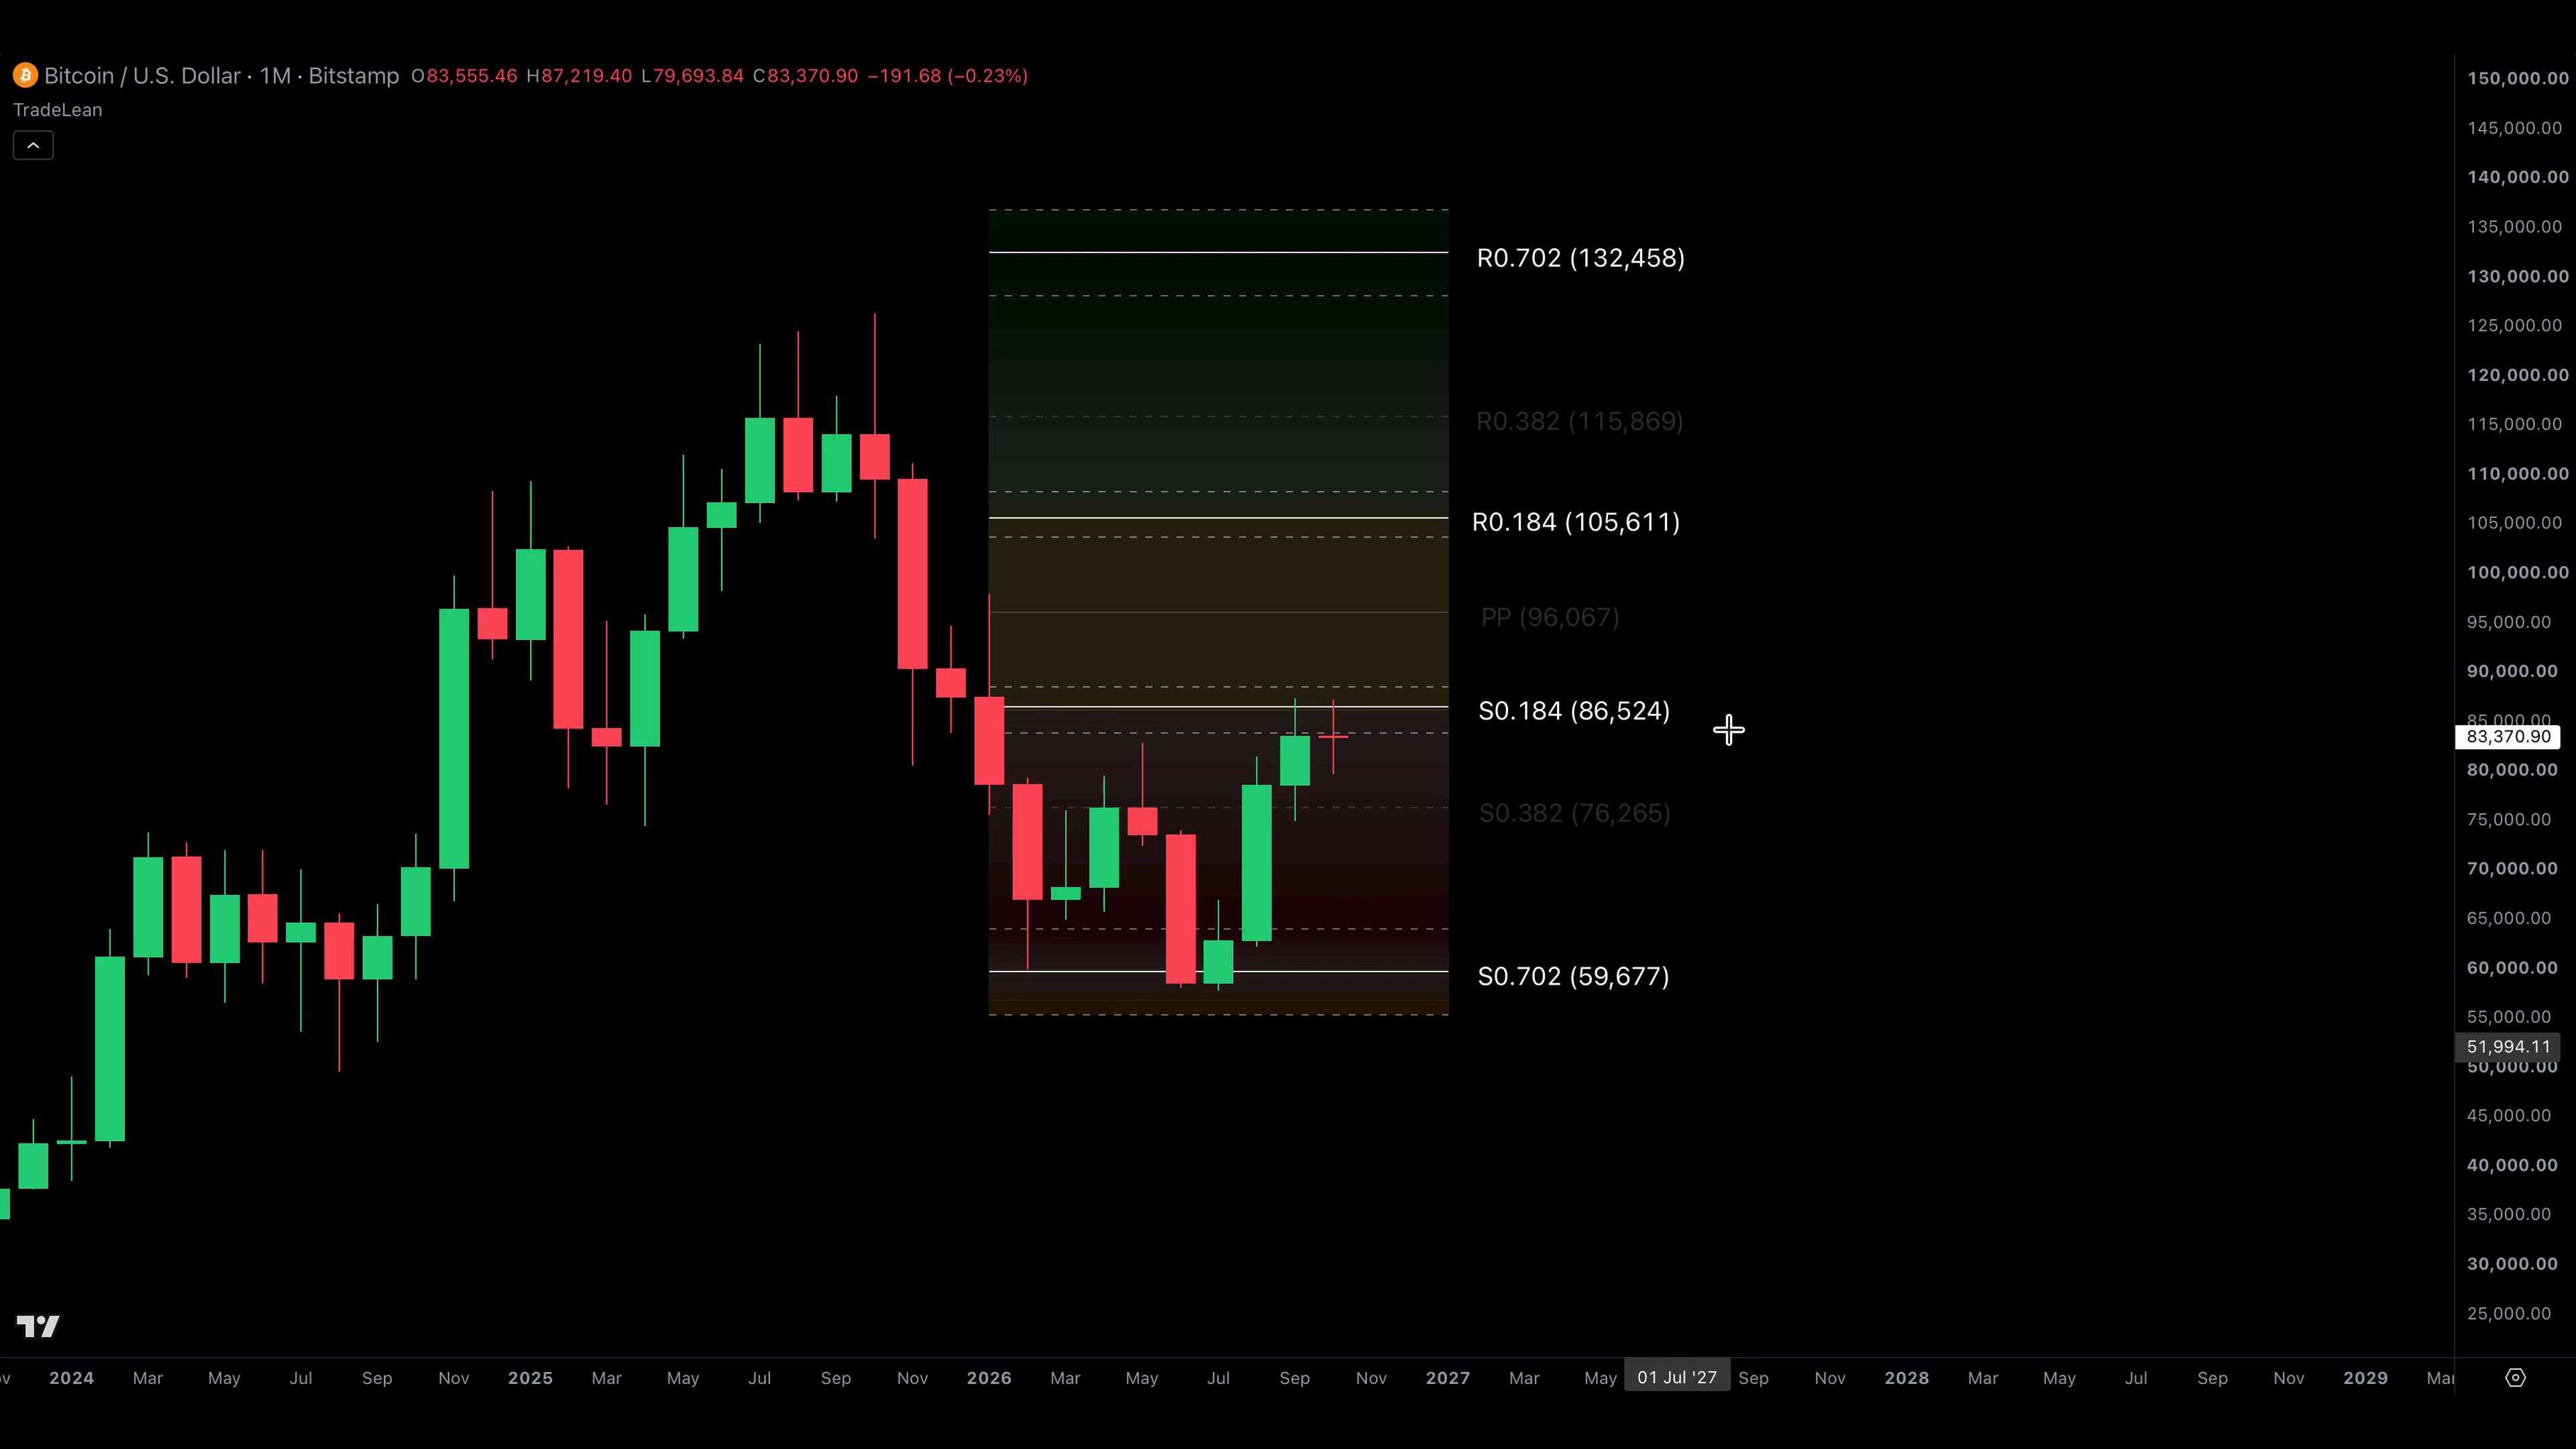
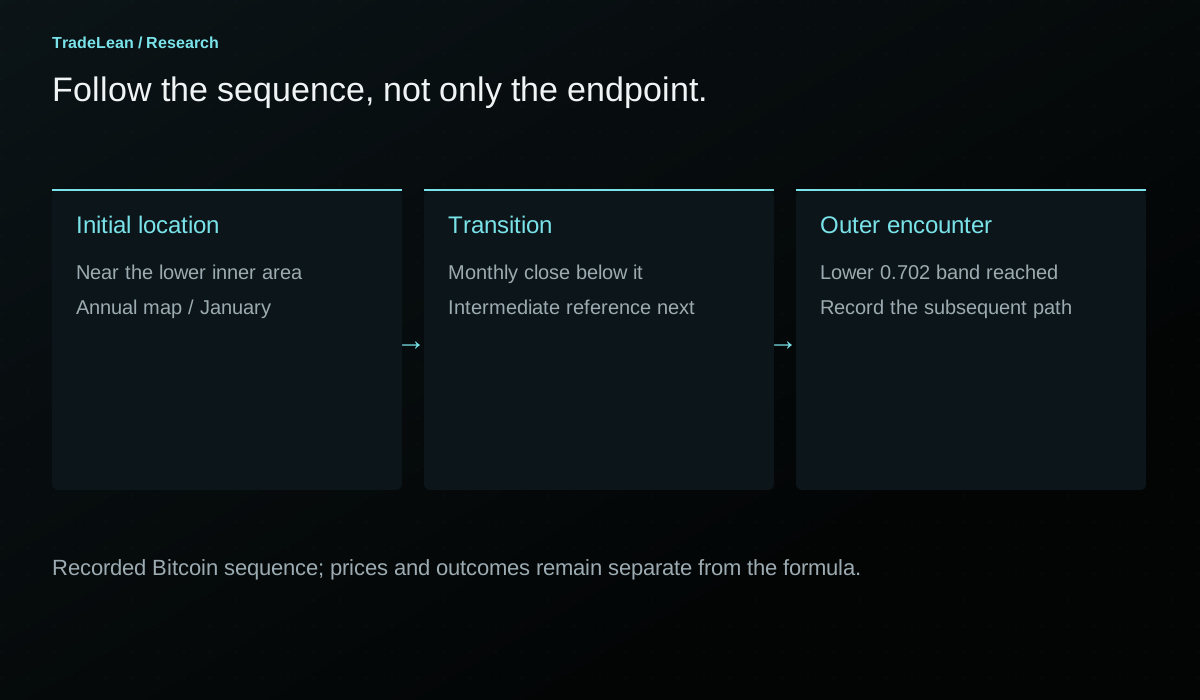
The 2026 example begins with an annual pivot near $96,000 and S 0.184 near $86,500, using the rounded values discussed in the recording. Bitcoin opened the year around $87,000, near the lower inner reference. The opening location was therefore different from the location at the end of January.
During the month, price first moved towards the annual pivot. The recording describes a rally slightly beyond that central reference, followed by a reversal below S 0.184. The completed monthly candle, rather than its highest intramonth print, is the observation used to classify the change in location.
January finished below the lower inner reference but above S 0.382 in the recorded example. This is important because the bearish classification and the encounter with the intermediate reference were not simultaneous. The annual map still contained another landmark before the outer support zone.
A useful way to read the sequence is conditional. If the lower inner band cannot be reclaimed and the intermediate support reference fails, the lower outer zone becomes a relevant area to monitor. That is a scenario with observable conditions. It is more precise than saying that one red candle predicted the rest of the year.
The numerical reconstruction in the first article uses rounded narration inputs. A particular exchange, quote currency or data setting can produce somewhat different levels. When reproducing the example, retain the source and settings of the chart you are studying instead of forcing your labels to match every rounded number in the commentary.
The journey matters as much as the destination
In the recording, February reaches the lower outer area after S 0.382 fails to contain the decline. Subsequent months revisit the intermediate reference without retaining a monthly close above it. Another decline follows before a later recovery towards the inner support reference.
That path contains several different analytical events. The first visit to an outer band is not the same event as a later low. A rebound from the outer area is not the same event as a return to neutral territory. A recovery towards S 0.184 can remain below the annual centre and therefore coexist with a bearish annual location.
A chart annotated only with the starting candle and the final destination leaves out these distinctions. It can create the impression that the map specified both direction and timing. The grid did neither. It supplied reference prices against which the unfolding path could be described.
For a fuller review, record the highest adverse move between an initial condition and an eventual destination. Also record how long the journey took, whether price returned through the originating band and whether a new pivot period began before the destination was reached. Those details decide whether an interesting chart observation can support a practical research hypothesis.
A destination reached after a full reversal and a long delay is not equivalent to a direct continuation. Both can touch the same line on a completed chart; they offer very different evidence about a rule defined in advance.
Bitcoin's recorded 2025 rejection at R 0.382
The 2025 example illustrates the other branch. Its rounded annual references were P near $80,000, R 0.184 near $93,000 and R 0.382 near $107,000. Price began near the upper inner reference, which made the opening location appear constructive relative to that grid.
The first advance towards R 0.382 did not become an uninterrupted move to the outer band. In the walkthrough, the market returns towards the central range and spends more time between the pivot and the upper inner area. That failed initial advance is part of the example, not an inconvenience to erase from it.
The later sequence distinguishes an April close around the inner band from a May close beyond the entire band. This is the line-versus-zone distinction in a concrete setting. An observation can move in the direction of a scenario without yet satisfying the stated condition for that scenario.
The research question is not simply whether an outer band was eventually reached in 2025. It is what happened after each defined event: the first touch of R 0.382, the return to the centre, the close within the inner band and the close beyond it. A study that selects only the last event after seeing the outcome would overstate the precision available at the beginning.
Keep the sequence in order. A roadmap becomes useful when it preserves the stages of the move, not when it supplies a different explanation for every candle after the fact.
The S&P 500 example: a wick and a close tell different stories
The recorded S&P 500 annual upper inner band runs approximately from 6,500 to 6,690. In the first-quarter example, price trades below part of that area during a correction, while the March monthly close returns inside it.
Under the monthly-close convention used in the walkthrough, the excursion is not the same as acceptance below the whole zone. A screenshot taken near the intramonth low would emphasise the breakdown attempt. A screenshot taken after the completed month would show the closing outcome. Both refer to the same period, but they answer different questions.
The later advance towards the upper outer band is useful context, yet it should not be read backwards into the March candle. The fact that the market subsequently rallied does not mean the closing rule eliminated every other possibility at that time. A historical example illustrates the classification; it does not establish a numerical success rate.
There is a second lesson here. A stock index and a continuously traded cryptocurrency have different session conventions. A monthly closing observation needs a defined feed and calendar. Differences between cash indices, futures and exchange-traded instruments should not be treated as cosmetic if they change the prices used in the grid.
The transferable idea is the distinction between trading beyond a zone and finishing the chosen observation period beyond it. The exact number on the axis belongs to the instrument and feed.
A repeatable location statement
A good chart note can be short without being vague. It should identify the instrument, the pivot period, the candle used for the observation, the location and the condition that would change the interpretation.
Consider this hypothetical note: on the annual grid, a completed monthly candle is below the lower inner band but above S 0.382; a monthly close back above the full inner band would change the current classification. That statement describes what is known and leaves the future open.
Compare it with a note that merely says bearish until further notice. The second version does not tell a later reader which grid mattered, how the state was defined or what further notice would look like. It is difficult to audit and easy to reinterpret.
The note also benefits from a timestamp. If a close is still pending, say that the candle is forming. If the observation was made after a major move, do not present it as an earlier published forecast. Recording the availability of information is part of the method, not an administrative detail.
| Field | What to record | Why it matters |
|---|---|---|
| Instrument | Full symbol, exchange and quote currency | Similar names can refer to different data |
| Grid | Monthly, quarterly or annual | Location is relative to a specific reference window |
| Observation | Daily, weekly or monthly close | A wick and a completed close are different events |
| Band | Exact lower and upper boundaries | Focal ratios do not describe the whole area |
| Current classification | Neutral, bullish side or bearish side | Makes the working description explicit |
| Change condition | A specified later observation | Prevents the interpretation from becoming permanent |
From a location statement to conditional scenarios
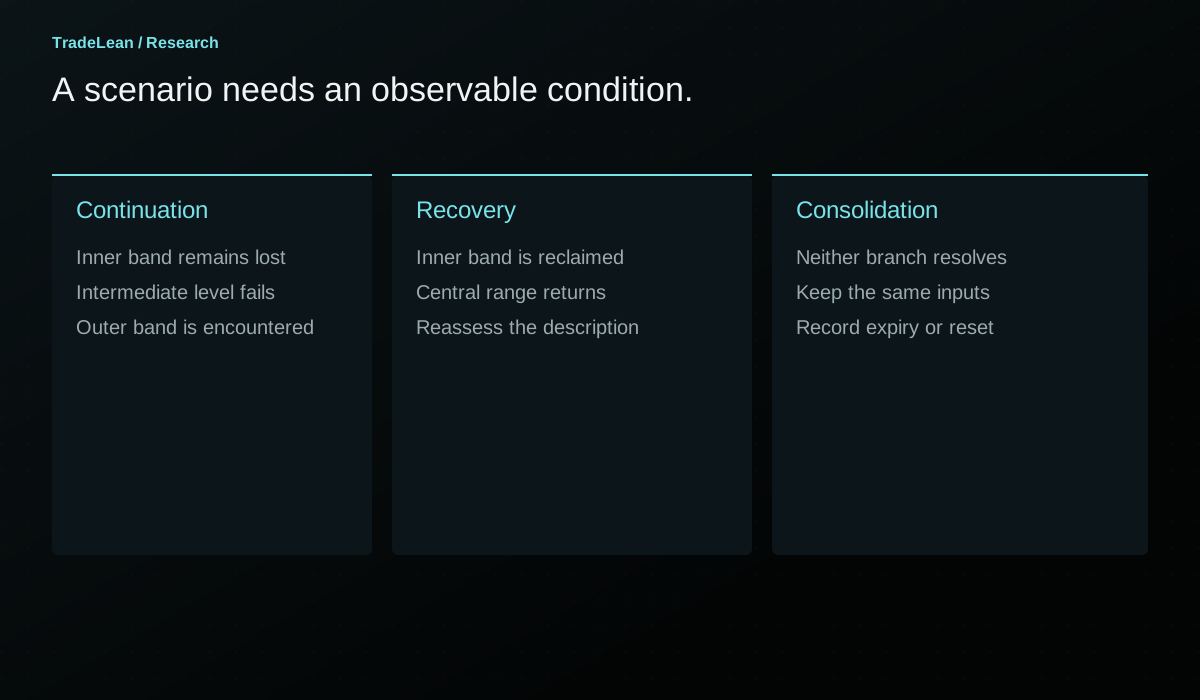
A scenario is a sequence of conditions, not a synonym for a prediction. After identifying location, define the next meaningful reference in each direction. The map provides the order of those references; the market still determines which one is encountered and how.
For a price below S 0.184, one scenario may involve continued weakness through S 0.382 towards the outer support band. Another may involve a recovery into the inner area and a return towards P. A third may involve consolidation between the first two references without either larger path developing during the observation period.
These branches should be distinguishable by observations that can actually be recorded. Continued weakness is too vague on its own. A completed close below a defined intermediate level, followed by a failure to recover the originating band, is a more specific description. It can still fail, but its failure is recognisable.
Do not assign percentages to these branches simply because the diagram has three arrows. Probabilities require a defined sample and a consistent event definition. The visual balance of a chart says nothing about the relative frequency of its possible paths.
Overshoots and the next set of references
The 0.702 band is an important part of the TradeLean map, but it is not a mathematical limit. A strong move can continue towards the 1.000 reference and beyond it. The formula can be extended to any selected multiplier without declaring that price is forbidden to travel further.
For example, R 1.184 is P + 1.184D. S 1.184 is the mirror below P. Those expressions describe where the additional references sit. They do not explain why a move reached them or establish an exhaustion probability at those prices.
In a location review, an overshoot changes the question. Instead of asking whether price will reach the outer band, record how far beyond it the market has travelled and whether the next completed close remains outside it. The same attention to bands and observation periods continues to apply.
Be especially careful when an overshoot occurs near a period reset. The old grid and the new grid are different calculations. A new monthly map can move its centre while the annual map remains fixed. Comparing the last candle of one grid with the first candle of another without identifying the reset creates a false continuity.
An observation plan for the next complete period
Begin with a clean chart and a single reference window. Calculate or display P, the inner bands, the 0.382 references and the outer bands. Record the settings before examining the period you intend to review. If you are studying historical data, use a replay or a date cutoff that prevents the later outcome from guiding your initial classification.
At each chosen candle close, write one location statement. Do not overwrite the old note when the interpretation changes. Add a new dated observation explaining which condition occurred. That record shows whether the framework helped you follow the market or merely helped you describe it afterwards.
At the end of the period, compare the path with the original branches. Include branches that never developed. Include an uneventful neutral period. Include temporary excursions that returned to the centre. Those cases provide the denominator missing from a collection of attractive outer-zone reactions.
The TradeLean worksheet provides space for the inputs, the reference levels, the initial observation and the subsequent review. It is a record-keeping tool. It does not calculate position size, recommend a trade or replace a separate assessment of execution risk.
Translate the map into a falsifiable research question
The phrase price tends to continue sounds straightforward until it is written as a rule. Continue from which event? For how long? Towards which destination? A test cannot answer all of those interpretations at once. It needs one operational question that another person could apply to the same chart without being told the eventual result.
For example, define an event as the first completed monthly close beyond an annual inner band. Define the destination as the near boundary of the outer band on the same side. Define the observation window as the remaining months of that annual grid. These choices are not recommendations; they are an illustration of how a general chart idea becomes testable.
Now define the alternative outcomes. The destination may be reached before a return through the original inner band. The inner band may be reclaimed first. Neither event may occur before the annual grid expires. These outcomes should be recorded separately. Treating an expired observation as a win merely because a later year eventually reaches a similar price would change the question.
A second study could use weekly closes on quarterly grids. That would be a separate specification. It might yield a different number of events and a different distribution of waiting times. Do not combine the results simply because both studies use the word pivot.
The research record should also distinguish discovery from evaluation. If the event rule was developed by examining Bitcoin's most memorable periods, those same periods are not an untouched test of the rule. They explain its origin. A later or otherwise separate sample is needed to examine whether the observation survives beyond those examples.
Measure the path before celebrating the endpoint
An eventual visit to a destination can hide a difficult intervening path. Suppose a hypothetical market closes at 110 above an inner band, retreats to 101 and later reaches an outer reference at 128. An endpoint-only description calls the destination reached. A path-aware review also records the nine-unit adverse move and the time spent recovering from it.
Neither description is inherently wrong. They answer different questions. The first asks whether a level was visited. The second asks what happened between the defined event and that visit. A trading implementation would need the second record, plus execution assumptions, before it could be evaluated responsibly.
Maximum adverse excursion should be measured from a declared starting observation. If the study uses the close that triggered eligibility, use that close consistently. If it assumes entry at the next opening price, the gap between the two is part of the result. Choosing whichever starting price makes the example look best creates an invisible advantage.
Maximum favourable excursion has a similar role. A market can move substantially in the proposed direction without reaching the exact destination. That may be useful evidence about the path even if the binary destination rule classifies the event as unresolved or unsuccessful. Record it rather than silently redefining the target.
Duration belongs beside those measures. A five-day journey and a five-month journey expose a reader to different information, different reset events and potentially different practical constraints. A fixed grid does not remove those differences.
| Research measure | Definition to decide in advance | Common ambiguity |
|---|---|---|
| Event price | Trigger close or next available opening price | Switching between the two after seeing a gap |
| Adverse excursion | Furthest opposite move before the endpoint | Ignoring a large recovery against the initial view |
| Favourable excursion | Furthest move in the proposed direction | Counting a near miss as a target after the fact |
| Time to destination | Number of declared observation candles | Mixing intraday and monthly timing |
| Expiry | Period reset or a fixed horizon | Letting an unresolved event run indefinitely |
What a genuinely neutral outcome contributes
A period that remains near P can look disappointing in an article built around dramatic moves. For research, it may be one of the most useful observations. It tests whether the framework encourages restraint when the defined transition has not happened.
Record how many completed candles remain within the neutral range, how frequently price crosses P and whether attempted exits close back inside the inner bands. Those are measurable descriptions of central trading. They are more informative than calling the chart messy and moving on to a cleaner example.
The width of the neutral range also matters. If D is large, the distance between S 0.184 and R 0.184 can be substantial. A market may move considerably in percentage terms and still remain central relative to the annual map. Conversely, a short-period grid built from a narrow range can be crossed by a modest absolute move.
This is why the roadmap should complement, rather than replace, a direct description of price changes. State both the physical move and its relative location. A recovery of ten percent that remains below the annual inner band is different from a ten-percent recovery that reclaims the annual centre. The percentage is the same; the map context differs.
Keep the review independent of a preferred narrative
A bullish or bearish label can become an identity if it is not tied to a reversible condition. Once that happens, the chart is read selectively: favourable reactions are emphasised and inconvenient closes are explained away. A location framework is most useful when it makes revision easier.
Write a change condition beside every directional interpretation. If a bearish annual location is defined by a close beneath the full lower inner band, identify the observation that would move it back into the central range. Do not require an unrelated story to change as well before acknowledging the price observation.
There can still be uncertainty after a condition occurs. A return inside the band may be provisional. Another chosen closing period may provide a different view. The solution is to state those different conventions explicitly, not to let the word acceptance expand or contract with each example.
A good review ends with a record that a sceptical reader can follow. The formula is visible, the event definition is stable, the timestamps are retained and the contrary outcomes remain in the sample. That is a stronger basis for market research than a perfectly annotated chart whose decisions cannot be reconstructed.
Questions that improve the review
Is one close enough to confirm a move?
One close is enough only to satisfy a rule defined as one close. It is not enough to guarantee a continuation. A rule requiring two closes or a subsequent retest is a different rule and should be evaluated separately. The important point is consistency between the condition written before the outcome and the event later counted as confirmation.
Does neutral mean the market is safe?
No. Neutral describes a position within a particular grid. It says nothing about leverage, intraday volatility, liquidity or the size of a possible loss. A wide annual neutral range can contain substantial price movement. A small chart can also be volatile while the market remains near the annual pivot.
Is the central pivot fair value?
The pivot is an arithmetic average of three observations from the previous period. Calling it fair value would introduce an economic claim the formula does not establish. It is a consistent centre for the roadmap, which is sufficient for the location framework described here.
Should the grid change after a failed scenario?
The inputs remain tied to their defined period. A failed interpretation is a reason to review the scenario, not a reason to move the original references. The grid resets when its reference window resets or its underlying data are corrected. Keeping those events separate preserves an honest record.
Can the same approach be used on another asset?
The calculation is transferable when appropriate high, low and close data are available. The observation convention still needs to reflect the asset's sessions, calendar and feed. A method applied to a cash index, a futures contract and a cryptocurrency can share its arithmetic while requiring different data checks.
Where should this guide fit in a wider process?
Use it to describe location before considering a directional interpretation. Then examine the relevant timeframe, the surrounding historical context and the conditions for changing that interpretation. The next guides examine the outer 0.702 band and connections across timeframes in more detail.
Check the calculation.
Enter completed-period prices to verify the focal levels and band boundaries. These inputs are illustrative and do not request live market data.
Your pivot grid.
| Reference | Lower side | Upper side |
|---|---|---|
| 0.184 line | 86,472.27 | 105,461.07 |
| 0.702 line | 59,743.47 | 132,189.87 |
Using the rounded Bitcoin example.
Andrey
Founder of TradeLean. Engineer with a PhD, senior industry executive and long-time investor and trader. The work brings Lean thinking to chart analysis, historical research and market foresight.
About the author ↗Join the conversation
Discussion
Questions, observations and thoughtful challenges to the research are welcome.
No comments published yet. Start the discussion below.
Leave a comment
Comments are reviewed before publication. Keep the discussion relevant and respectful; please avoid personal financial or account details.
Educational research, not personal investment advice. Historical examples and hypothetical illustrations do not establish future performance. Risk Disclaimer.